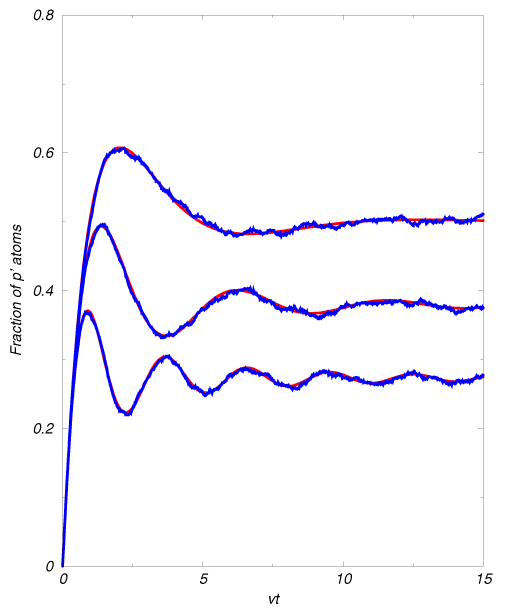

This is a plot of the results of the simulation in the absence of the U process, for three values of the detuning (blue). For this series of three plots the simulation was run for 10000 realizations of a sample of 100 atoms. Also shown are the analytical curves derived in Ref. [4] for the same values of the detuning (red). The agreement is quite good.